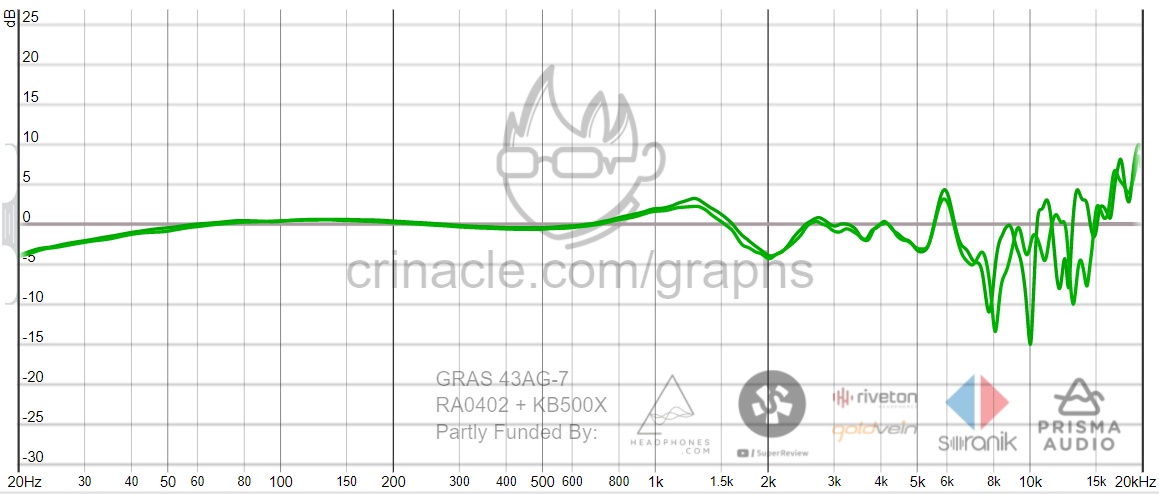
About headphones measurements and frequency response in particular
This article is a part 2 of this article on target curves.
Let’s start by answering a simple (but not too simple, actually) question: what are the headphones sound parameters that can be measured at all? Or, more precisely, the sound parameters that are usually measured. I’ve divided those into two categories: the main ones – the most significant and frequently cited, and the additional ones – less significant, but also important.
Main measurements
- The frequency response is the dependency of the sound pressure level on the frequency of the reproduced harmonic signal at the headphones output. The frequency response is a reflection of the played sound volume at different frequencies. In the audiophile universe, it’s called tonal balance. The frequency response is the most significant characteristic of the headphones sound delivery. This is what we most often pay attention to when describing the sound.
- The cumulative spectrum (waterfall) reflects resonances and reverberations at different frequencies after the headphones stop playing the signal. Each resonance adds a certain emphasis to its corresponding frequency. If the amplifier also introduces some distortion, such a distortion is going to be amplified at the resonant frequencies. At some point, the resonances can be considered as a qualitative parameter, where less is better. However, it’s still more correct to address it as a versatility indicator, like less resonances mean less glitches visibility on the amplifier side.
- The impulse response — a response to a single shortest possible impulse. The pulse response wave form primarily depends on the frequency response, the attenuated resonances and reverberation of the headphones themselves, as well as on the acoustic test chamber stand. The total length of the impulse is about 5 seconds, while visually it’s somewhere around 2-4 milliseconds long.
Additional measurements
- The frequency response + equal loudness curves — the graph shows the change in the perception of the headphones frequency response when listening to music at different volumes in accordance with the equal loudness curves (Fletcher-Munson curves). As far as I know, it’s only available with the measurements from the Reference Audio Analyzer website.
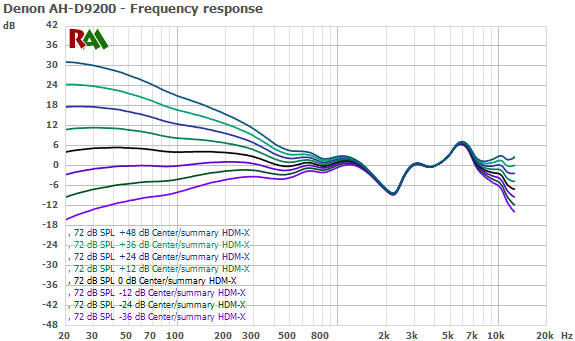
- Step response (transient response) — the very beginning of the square wave front at zero frequency. It’s drawn based on the derivative from the impulse response. Based on such transient parameter, the correct polarity of the speaker emitters is usually determined. In the audiophile universe, the square wave is usually used to determine the headphones ‘speed’, but this parameter is only applicable to amplifiers featuring an even frequency response with no reverberation. And it’s completely inapplicable to headphones.
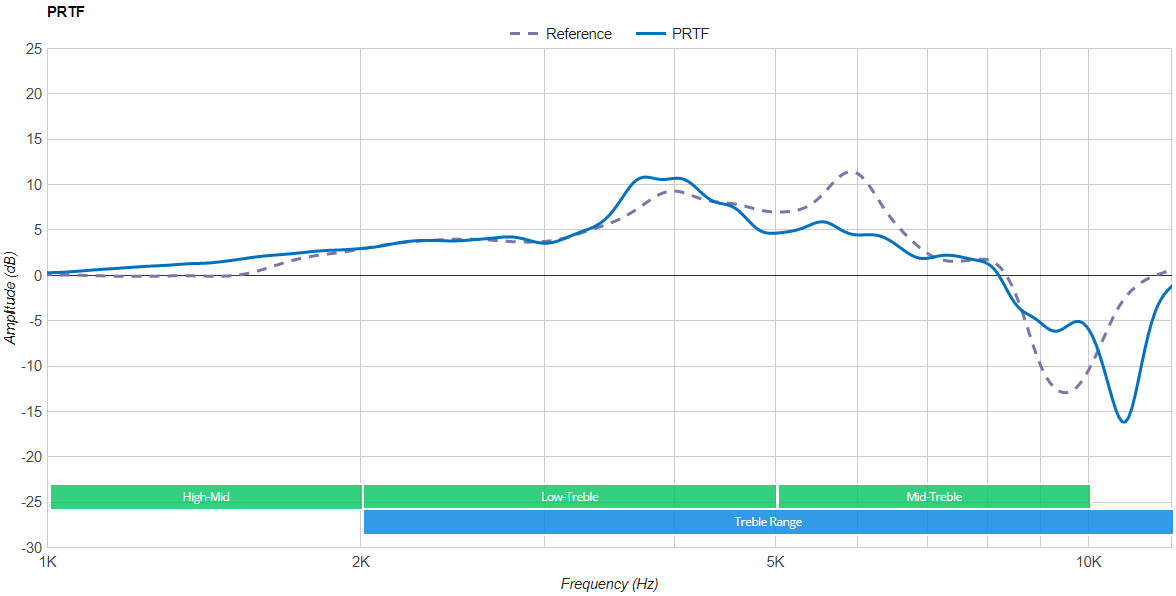
- The passive soundstage is an integral parameter allowing to evaluate the quality of the headphones virtual soundstage configuration. The measurement method is a proprietary development of the Rtings.com website laboratory, so the measurement results can only be found in their reports.
Here’s how it works: the concept of PRTF (Pinna-related transfer function, by analogy with HRTF) is introduced. The PRTF value for headphones is calculated as the difference between the measurements of the headphones on the dummy head with and without an artificial ear. That is, in fact, the headphones PRTF allows you to know to what extent the auricle (aka pinna) impacts sound perception for any headphones model. Then, the PRTF for headphones is compared with the benchmark PRFT. That benchmark PRTF is obtained by measuring the response of microphones inside the dummy head to the swipe tone, which is played using a speaker installed in front of the stand at 30 degrees, at the level of the ears. Here is what’s calculated then:- Standard deviation: the root-mean-square deviation of the PRTF for a 2-7kHz range.
- Virtual soundstage size: the average value of the PRTF amplitude for the 2-7kHz range.
- Virtual soundstage depth = [virtual soundstage size] – [minimum value of the PRTF amplitude in the 8-12kHz range].
These 3 parameters (plus 2 less important ones) help forming the general idea of the headphones passive soundstage. For a description of the measurement and calculation methods, click here. As for the results of the headphones measurements sorted by this parameter, these can be found here. Looks credible to me.
- Full impedance — this graph shows the impedance of the headphones at different frequencies.
- Electric phase determines the lightness of the headphones from the point of view of the load they impose for the amplifier.
There are still quite a number of measurements I’m not covering here because of their insignificance, irrelevance or rarity.
As for the logical question like what and how you can measure in terms of headphones, then there’s no such comprehensive list of parameters. In the same way, another and, in fact, the main question doesn’t have any clear answer: which of the parameters are significant when assessing the sound quality? This one calls for a separate article: unfortunately, I just don’t possess enough knowledge or experience to write on the subject.
Next, I’m only going to cover the analysis of the frequency response measurements given on various websites. In general, how do you read a frequency response graph?
Scale, gradation, smoothing and normalization
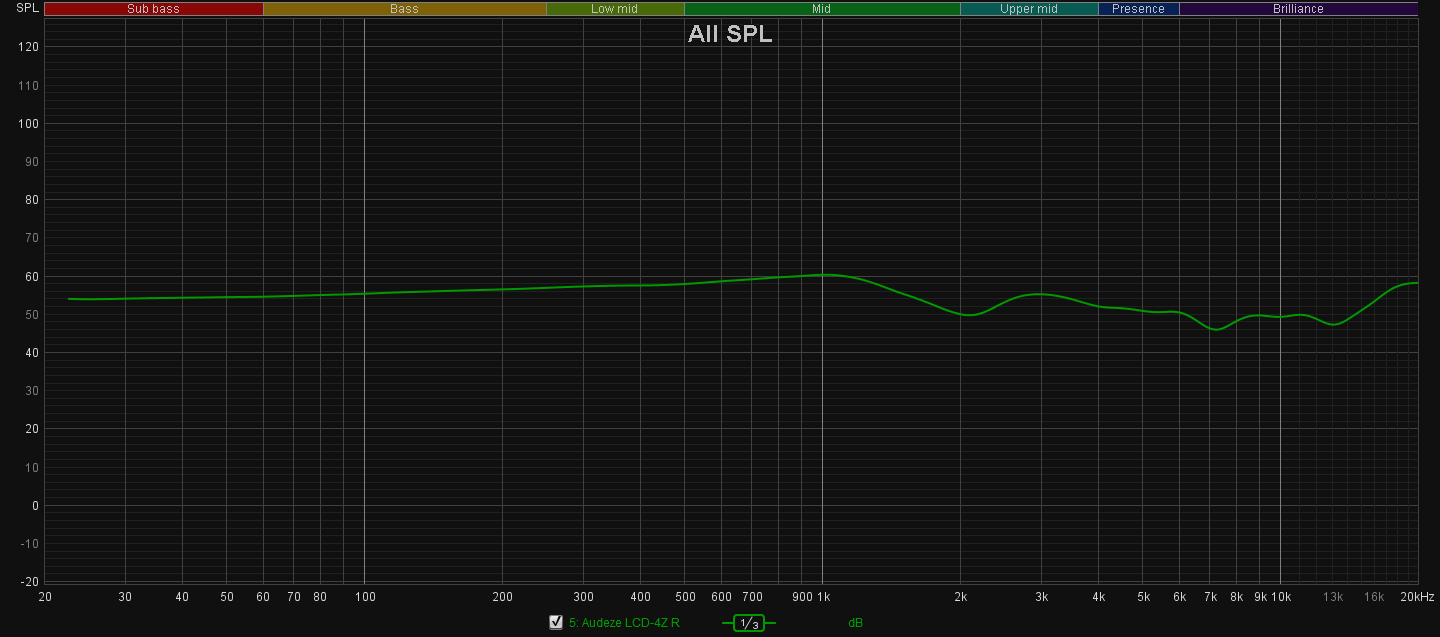
Below are three pictures showing the same headphones parameters:
Why are these pictures different?
The first thing you need to pay attention to when you look at the frequency response graph is the scale. In the first picture, a Y-axis section from 10 to 100 dB is selected. The larger the segment – the flatter the graph is.
The second thing is the measuring gradation. To display the frequency response graph, it’s usual to use a logarithmic scale, but the graphs are often shown in a linear form, too. In the second picture, the same frequency response graph is shown in a linear form, and a Y-axis 30-75Hz section is selected.
The third thing is smoothing. In its pure form, the frequency response graph is usually pretty uninformative, since it has a huge number of small deviations that don’t even reflect the nature of the sound: these only hinder the overall visual assessment of the graph. Therefore, one of the types of smoothing is usually used: 1/n-octave (where, for example, 1/3 is for the least detailed and 1/48 corresponds to the most detailed) or psychoacoustic. Usually, the type of smoothing is indicated somewhere in the graph description or on the graph itself. The standard smoothing is 1/12-octave. In the third picture, the 1/3-octave smoothing is applied, which is indicated at the bottom, in the legend section.
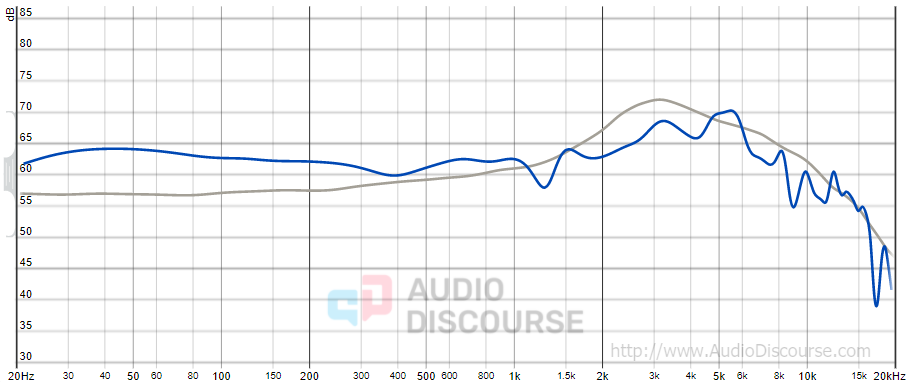
The fourth thing is normalization. In general, you can only normalize something relative to something else. When it comes to a normalized frequency response graph, it’s always implied that there’s a certain target curve, and the headphones frequency response graph is normalized relative to that target curve.
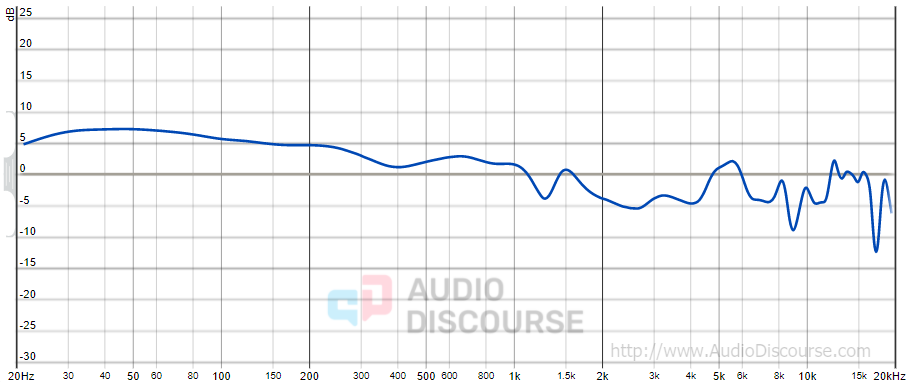
The normalized graph shows the deviations of the measured headphones frequency response from the target curve.
Here, the source dimensions are drawn in blue, and the target curve is gray:
The measurements shown are normalized relative to the target curve:
The normalized frequency response is used quite often, and this is easy to understand why: in this way, it’s so much easier to assess the degree of the headphones frequency response deviation from the target curve in different ranges.
Here’s an obvious, but important piece of knowledge for you: the look of the normalized graph depends on the target curve, since there are different target curves. The headphones do-all flat response doesn’t exist: any versatile flat response only works in the sense of normalization with respect to a specific target curve, like Harman curve or diffuse field, or free field, etc.
Summing up: when looking at the frequency response graph, you need to pay attention to the following.
- Scale
- Gradation
- Smoothing
- Normalization
If one of these parameters is missing or can’t be determined, then your graph is useless.
Do you need to know anything else about a frequency response graph? Well, yes. You need to know which acoustic test chamber was used for the measurements.
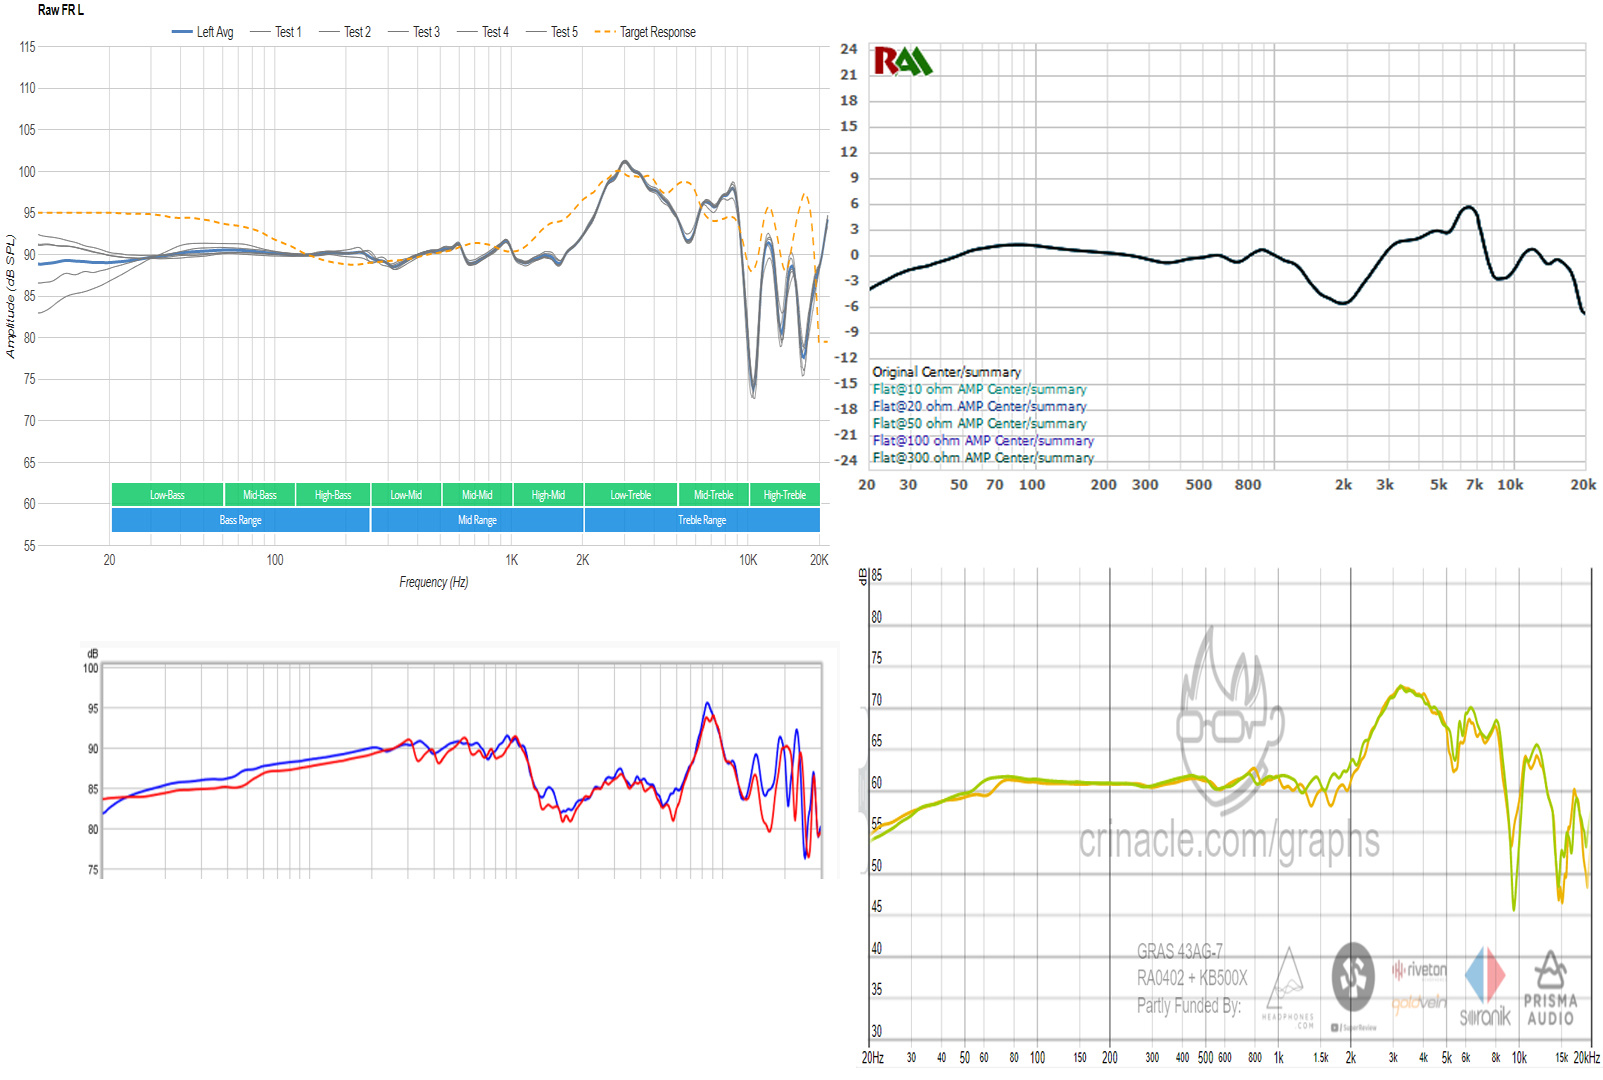
Let’s just compare the non-normalized measurements of the HiFiMan Ananda headphones obtained from different sources (rtings, Crinacle, RAA, DIY-Audio-Heaven) at the same scale:
Which is the correct result here? This question has no answer, of course, because of the different test stands used, and we aren’t able to compare these measurements to the real sound perception. If only we knew what a standard target curve would look like for a particular test stand… Then yes, we could assess the normalized graphs.
Now it’s time to look at the most traumatic part. Again, there are many different target curves, and we can somewhat call the Harman curve obtained with the GRAS 43 acoustic test chamber to be the “winner”. The next question is whether it’s possible to fit the Harman curve with the measurements obtained using another test stand. The answer is no, you can’t, because any other test stand may use a silicone artificial ear with a different geometry or not use any ears at all, the auditory canal may simulate natural curvatures or may just be a straight tube, etc.
Let’s talk about different acoustic test chambers and measurers.
Measurers and test stands
- Crinacle and Oratory1990 are the two most famous independent reviewers/measurers. Both use the same GRAS 43 test chamber meeting the 60318-4 standard, and you can apply any known target curves (diffuse field, free field, Harman curve, etc.) to their measurements in their unchanged form.
- The RTings.com use a unique test chamber, which is a Head Acoustics HMS. For the target curve they use something in between the Harman curve for lower and mid-frequencies and the diffuse field curve for higher frequencies (see the picture). ‘This is because the Harman target response was derived using a dummy head different from the one used by us, and therefore its treble range, which includes the ear resonances, doesn’t match the ear resonances of our dummy head.’ This test stand doesn’t meet any industry standards.
- The Reference Audio Analyzer use some unique HDM-X test stand to measure full-size headphones, and its specs are pretty close to the IEC 60268-7 standard requirements.
- The SoundStage! use the GRAS43.
- The soundnews.net use the miniDSP Ears. This Chinese test stand doesn’t meet any standards and comes with a certain HEQ target curve (‘headphone compensation for flat EQ target’), which is vaguely similar to Harman curve (to cite the source “inspired” by Harman target curve,).
Summing up: there are two main ideas I want to convey here.
First: without specifying the acoustic test chamber used (and all four parameters that I’ve mentioned above), the headphones frequency response graph doesn’t make any sense.
Second: you just can’t compare the headphones frequency response graphs from different test stands.
I’m going to elaborate this one in the next section.
Comparison of measurements from different test stands
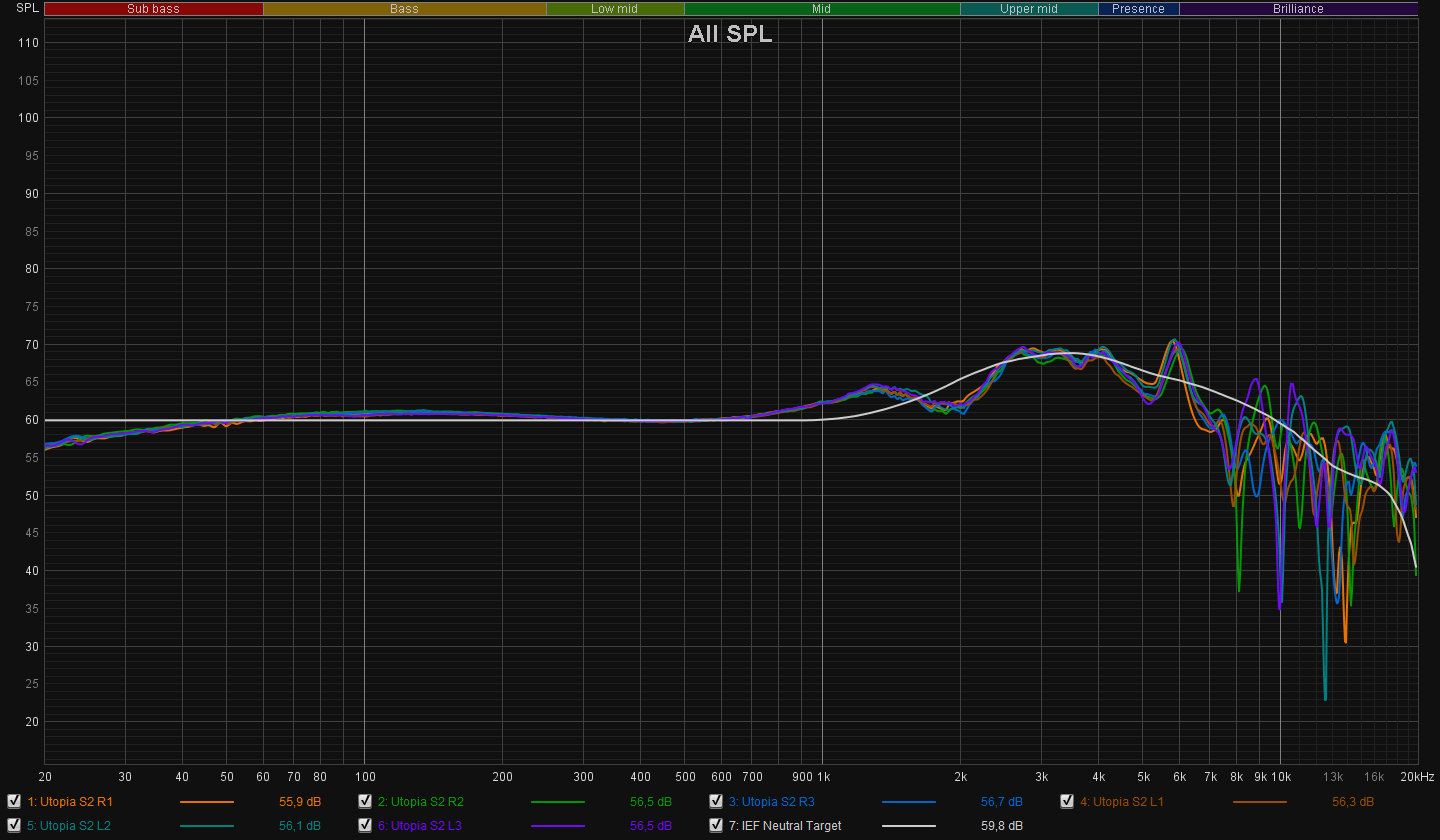
So, can you really compare measurements from different types of test stands? Yes, but the comparison would be quite inaccurate. Here’s an example from my own experience. I’m using a modified miniDSP EARS rig. This is what the Focal Utopia measurements look like without normalization and smoothing on this rig:
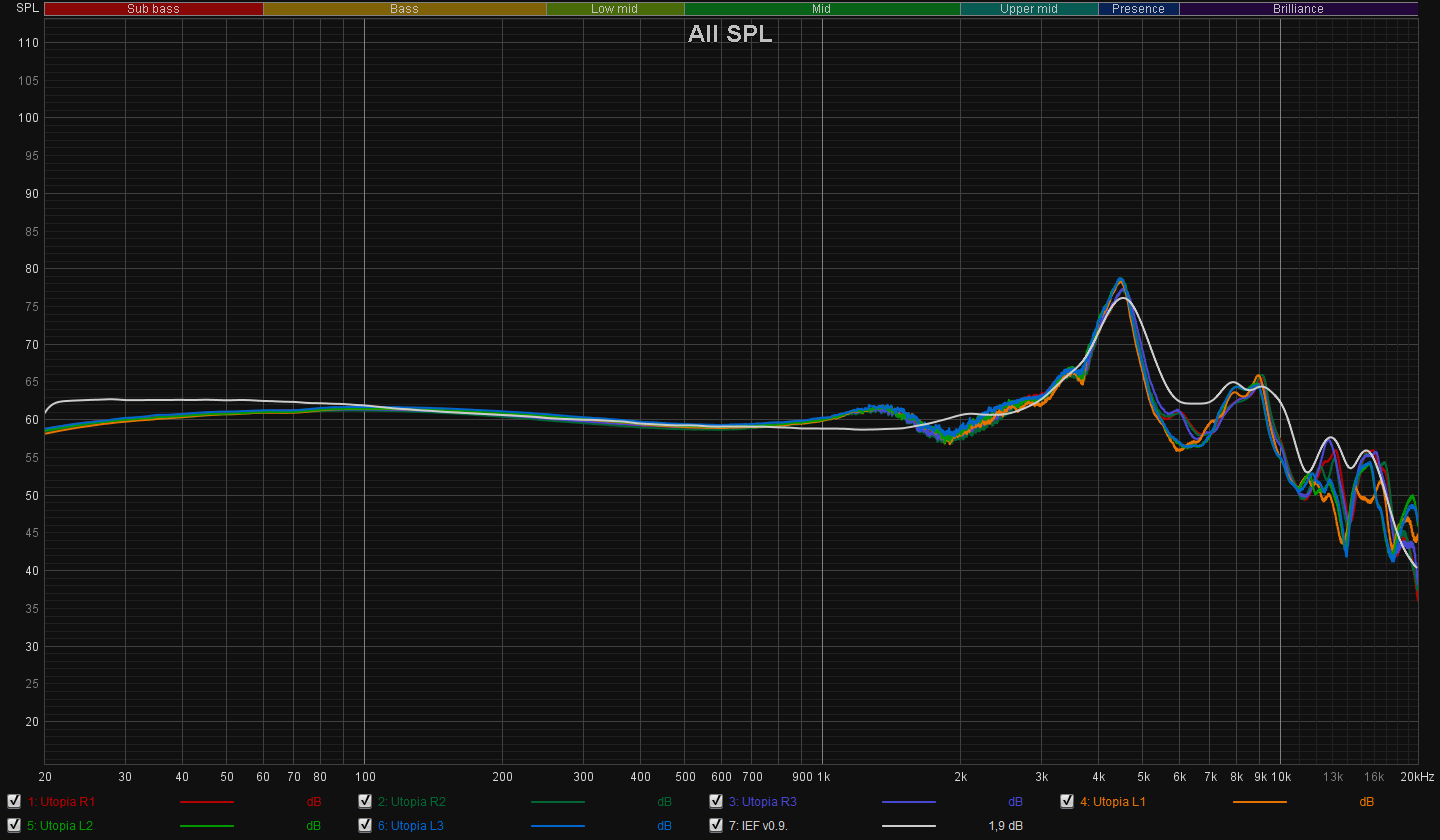
And this is what the Focal Utopia measurements look like with the GRAS 43 test chamber. The IEF target curve is gray here.
As you can see, up to 2kHz, the graphs are more or less similar, and then they diverge completely. Just because of the different test stands used. However, we’re here for that deviation from the target curve, not the overall graph. We’re looking at the same headphones model, too. That being said, it should be possible to transfer the target curve from one test stand to another using the measurements for this specific model. And here is the result: the IEF curve drawn in the coordinate grid of my rig, shown gray:
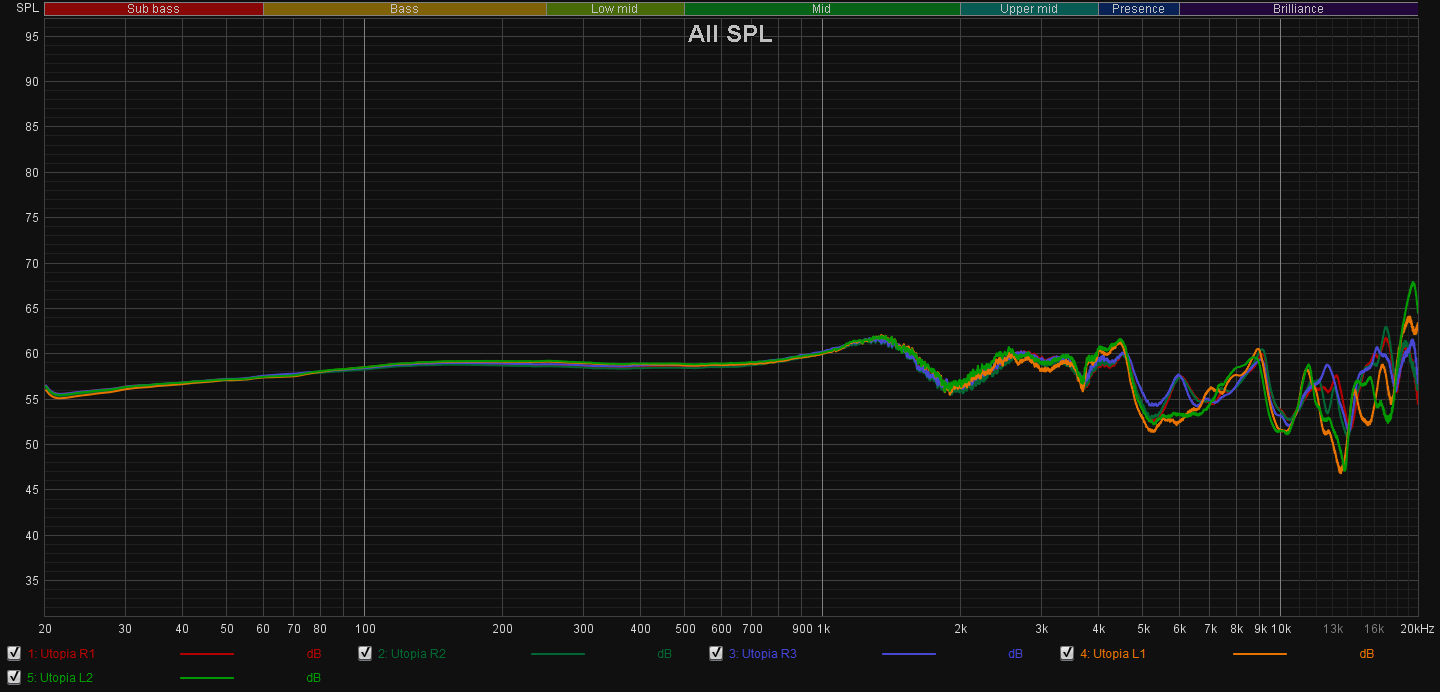
Now, let’s take a look at the normalized measurements – mine (miniDSP EARS) and the GRAS 43’s:
Any similarities you see? Well, there’s something in common, at least.
But of course – these would never be identical, because of the following:
- The headphones measured are different instances. Even if the headphones are worth a wild ton of money, two different pairs of the same model are just not identical in terms of measurements. For example, Crinacle provides measurements of three different pairs of Focal Utopia having different frequency response. And I, among other things, didn’t even breathe anywhere close to the specific pairs that Crinacle measured.
- The measurements highly depend on the fit of the headphones on the rig. And even more – on the position of the drivers inside the earcups (see Focal Utopia, Sennheiser HD800, etc.). If these are positioned at an angle, then, even with a micro-shift, the frequency response in the higher frequencies section can change radically by ±6-8dB.
- The measurements highly depend on the pressure of the earcups against the setup, too.
Moreover, when transferring the measurements, you need to choose pairs of measurements from your own and someone else’s test stand so that, roughly speaking, the imperfections coincide. Choose several pairs, see what happens, exclude the wrong options, check the resulting target curve using other headphones, further specify the results, repeat everything. It took me 3 months and 28 pairs of different headphones. For the basic transfer of the target curve, I chose the Audeze LCD-4X, Sennheiser HD800S, Denon AH-D9200, Focal Utopia, Meze Empyrean, Fostex TH-900 Mk2 and a number of very expensive models keeping in mind that the difference between instances of more fancy headphones should be somewhat less than in cheaper models. The result is already shown above, and it seems pointless to specify it further, although it’s still far from being perfect.
I’d also note that this whole transfer theory only works if the difference in measurements between the setups is linear. This is what I want to believe in, but can’t prove in any way.
Summing up: the measurements obtained using different rigs are comparable if there’s a way to align them, or you can deduce the same target curve applicable for different test stands. At the same time, you should always remember that this is a very rough comparison.
Comparison of measurements from the same type of test stands
With the course of time, the GRAS 43 acoustic test chamber became some sort of a benchmark rig. This one is the most expensive among the fellows (around $7,500 for the whole set, they say; the GRAS don’t publish prices), but delivers the most consistent results. Are measurements, taken on different instances of a test stand (for example, individual GRAS 43 instances) comparable?
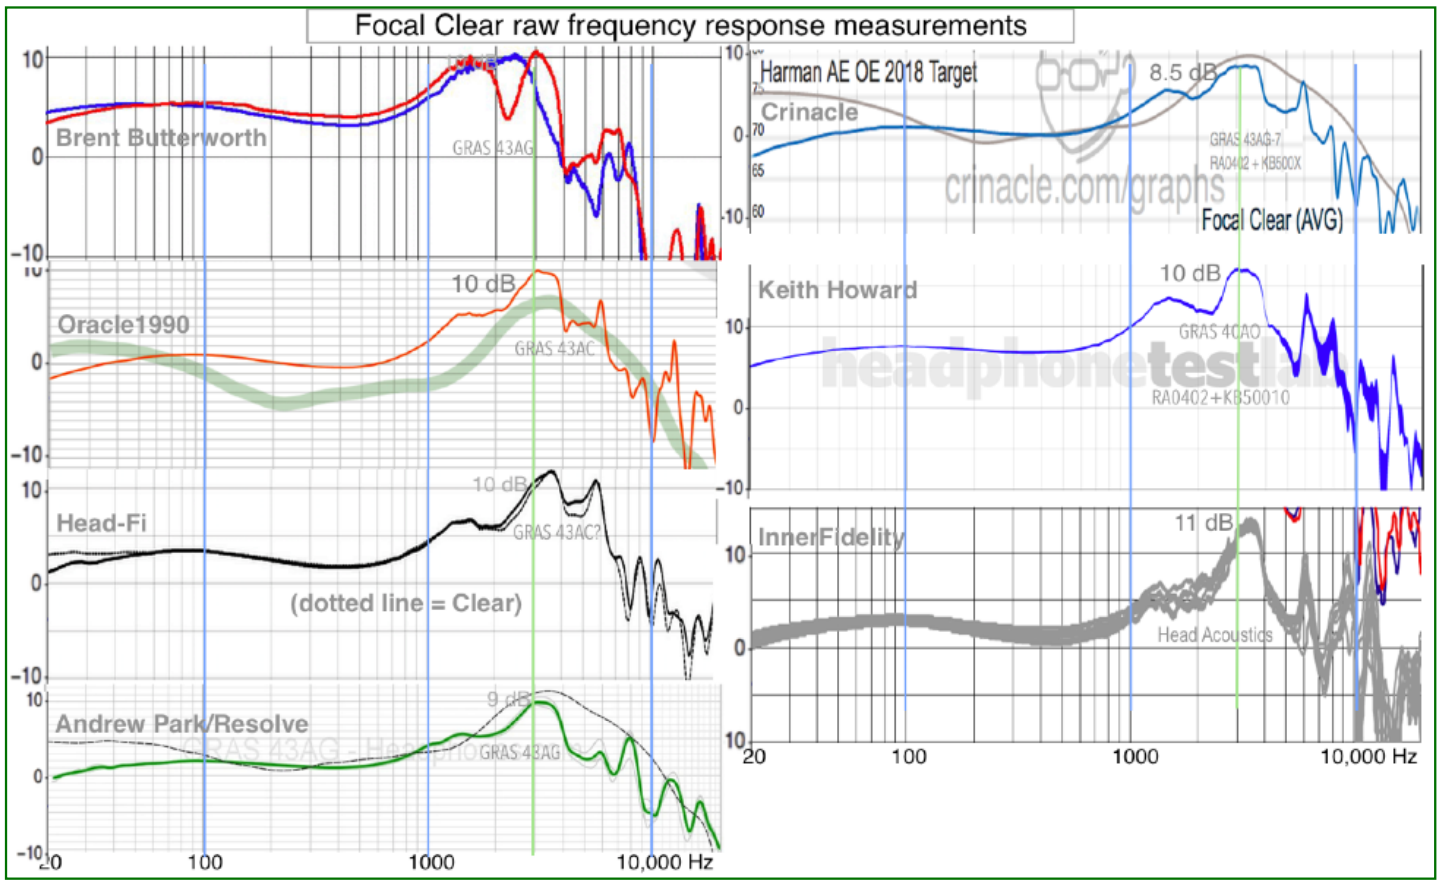
I’ll just show you this picture of the Focal Clear measurements obtained with several GRAS test stands (source):
That is, the comparison is possible and the nature of the curve looks somewhat the same, but they are just too far from being identical. Like I’ve already said, this all is due to deviations of specific instances of headphones, different pressure against the rig, etc. In other words, this is due to different measurement methods and physically different headphones.
Conclusions
When you look at the headphones frequency response graph, the first things you need to know are:
- The test stand.
- Normalization.
Pay attention to the following:
- Scale.
- Smoothing.
- Axis scale.
If you can’t find information about at least one of the above parameters, you shouldn’t trust those specific measurements.
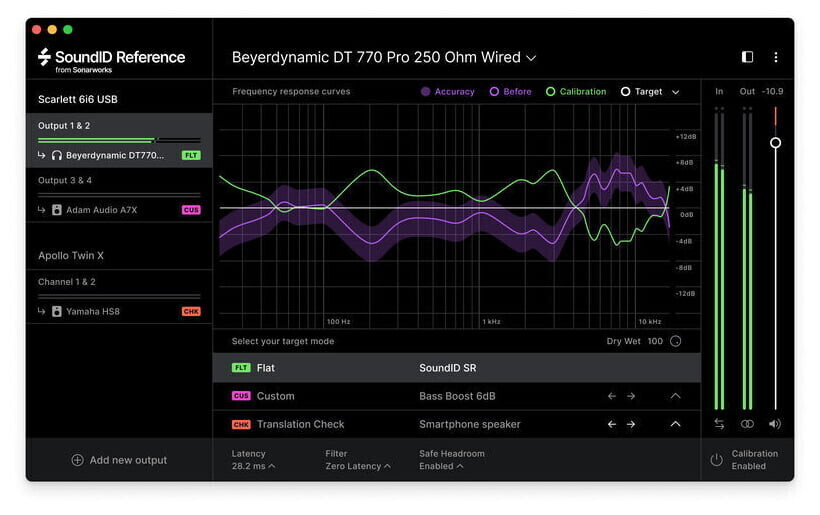
Similarly, you can apply this idea to some trendy products such as Sonarworks SoundID Reference, which allow you to equalize headphones and bring their sound delivery to a certain reference. The graph below shows a certain ‘Target’ in white — the target curve, which is flat in this case.
That is, the frequency response graph (purple) is shown in its normalized variation. So, the question stands, what target curve is it? What exactly do Sonarworks mean by neutral sound? Wish I knew…
If you want to compare the sound of two pairs of headphones, it’s always better to use one sound source and one measurer. Don’t – just don’t! – compare measurements from different sources. In terms of absolute values, the measurements made with even crappiest DIY‑ed rig can be anything, but it’s still okay to use them to compare some headphones with others provided you are still measuring both with the same DIY-ed rig.
Even if you come up with your piggy bank and buy an expensive standardized test stand like GRAS 43, the measurements from different measurers can easily differ.
Now that you know it, measuring even one headphones parameter (that is, the frequency response) is not that easy, right? So far, our progress with measuring methods is quite limited: we know how to measure some things using some methods. It’s not accurate, nor does it have any consistency. But we have no other methods invented yet. Should we immediately abandon the measurements and rely only on our hearing? No. You should, as always, approach everything consciously and ask yourself some pretty simple questions, like ‘What is this graph?’, ‘How do I read it?’, ‘What conclusions can be drawn?’.
P.S. If by any chance you have a feeling that I’m that guy who ‘reached nirvana and understood the world’, then you’re wrong. I’m still far from understanding ‘everything’. I just tried to gather the information and put it in an intelligible form. If you have anything to say, if you saw an error, if you have anything to add or specify, please don’t hesitate and comment, and I’ll be more than happy to make the article more complete and accurate.
Known measurement databases
- In-Ear Fidelity (Crincale). The largest collection of measurements for in-channel and full-size headphones.
- Oratory1990. A pretty extensive database of measurements for full-size and in-channel headphones. According to some, the Oratory1990’s measurements are even more accurate than Crinacle’s. I’m no judge. A separate advantage is that Oratory specifies the necessary equalization parameters (for different target curves) for all the headphone models they measure.
- Rtings – headphones reviews and measurements, including assessment of the virtual soundstage (see above), passive and active noise reduction for the corresponding models.
- Reference Audio Analyzer – the main Russian-language database with headphones and other hardware measurements. There are many parameters there that you may not see in other databases. The test stand they use is the HDM-X. Some good basic theory is also there.
- SoundStage! – not much, but there are some rare models to look at.
- HeadphoneTestLab – extensive database, detailed measurements, mostly for full-size headphones. They use GRAS for their measurements.
- ClarityFidelity – mostly in-channel models. They use something close to IEC 60318-4 as a test stand. Please note that there weren’t any updates on the website since July 2020.
- The Ear-Fi Blog – many in-channel and TWS models. Don’t be afraid to use Google translator in case you aren’t fluent in Korean.
- OratoryGrapher is basically a grapher for Oratory1990’s measurements. The test stand they use is GRAS.
- miniDSP EARS Grapher – a grapher for various headphones measurements made with the miniDSP EARS rig. It’s an open source project, so you can upload your own measurements. That is, the reliability of submitted posts is kinda questionable.
- Audio Discourse – a little bit about the full-size, and a whole lot of information about the in-channel headphones. This one is particularly interesting, since for the in-channel models, you can enable the display of target curves used on the rtings.com, SonarWorks, and the now abandoned InnerFidelity. The test stand they use is GRAS.
Useful links and sources
- Some information and ideas on the measuring acoustic test stands/rigs and the results obtained: link.
- The source code of the (old) online grapher used by Crinacle, Audio Discourse, and many others. Just in case any of you are interested, here’s the link.
- The Skinny on Headphone Frequency Response Graphs is a great article dedicated to headphones measurement graphs. The rest of the cycle is informative, too.
- Comparison of headphones measurements made by Crinacle, Oratory, RAA, headphones.com and others.
- An excellent analysis of measurement rigs from Crinacle.
- An awesome database of measurements and target curves from Jaakko Pasanen, creator of the AutoEQ. You can download it and browse through it in any appropriate application.
- Finding Flat: How to Interpret Headphone Measurements is the best headphones measurements-related lecture read by Tyll Hertsens.
- The protocol (regulations) for measuring headphones, quite an insightful one. If you want to measure the headphones by yourselves (and do it well), be sure to read it.
- A priceless video by Rtings.com about the problems related to headphones measurement.
- Comparison of measurements made with miniDSP EARS and GRAS 43 rigs.
- Here, the SuperbestAudiofriends.org website users try to get a more accurate target curve for miniDSP EARS.
Like this post? You can support me on patreon.
